Basic Information on Wastes (Recycled Resources) in 2012
| Type of Wastes (Recycled Resources) | Producing Amount(Ton/Year) | Eliminating Amount(Ton/Year)) | Reusing Amount(Ton/Year) | Reusing Rate (%) |
|---|---|---|---|---|
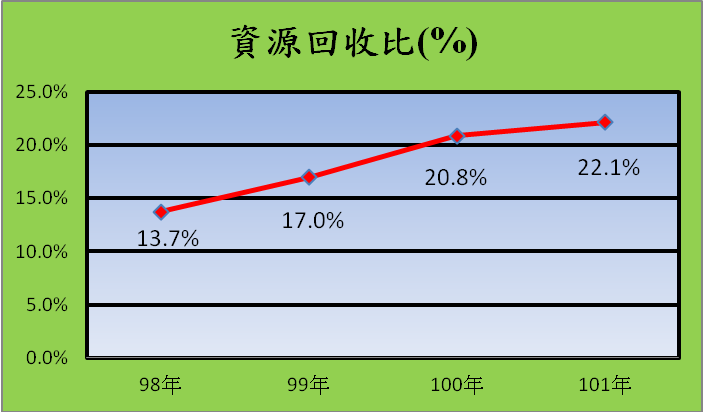
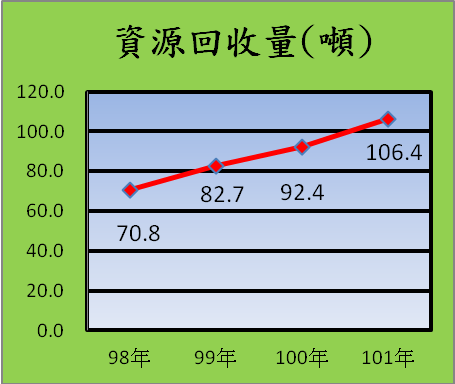
| Common Wastes | 480.6 | 374.2 | 106.4 | 22.1% |
| Domestic Sewage | 148036 | 105619 | 42417 | 28.6% |
| Chemical Wastes | 2.19 | 2.19 | 0 | 0 |
| Bio-medical Wastes | 0.16 | 0.16 | 0 | 0 |

Recycling Rate 2009 2010 2011 2012

Recycling Amount (Ton) 2009 2010 2011 2012

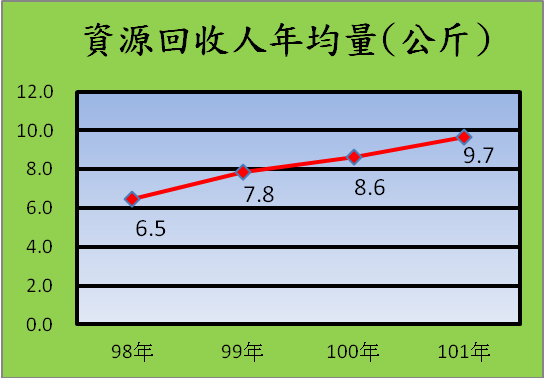
Average Individual Recycling Amount a Year (Kilogram) 2009 2010 2011 2012
Actual Measures
.Practicing E-official paper to reduce paper consumption. In 2012, about 29000 pieces of paper were reduced.
.Promoting the recycling of batteries, discs, and toner cartridges.
.Donating second-hand textbooks. In 2011, 252 books were collected, while in 2012, 600 books were collected. About 300 financially underprivileged studentswere helped.
.Building poisonous chemical and dangerous material circulation platform. In 2012, the purchase of poisonous chemicals was reduced by 3.85 kg while dangerous materials by 20.8 kg.
.The replaced teaching materials were collected and donated to junior high schools and elementary schools in the neighborhood.
.The beddings left by students in the dormitory would be cleaned and donated to villagers in the neighborhood.
.The replaced computer equipment would be collected by the Computer Center and donated to social service institutions.